
Accretion/dilution compares post-transaction EPS with the buyer’s standalone EPS, but EPS accretion is not the same as value creation. Financing mix, purchase accounting, synergies, interest rates, target earnings quality and new shares can make a deal EPS-accretive while destroying value—or initially dilutive while creating long-term value.
Finin2min takeaway
- Define the model purpose before computing.
- Use source data and accounting/valuation assumptions applicable to the model reference date.
- Separate accounting measures, management metrics, valuation assumptions and cash-flow effects.
- Reconcile every material output to source data, formulas, sensitivities and the decision paper.
1. Overview — what exactly are we analysing?
Accretion/dilution compares post-transaction EPS with the buyer’s standalone EPS, but EPS accretion is not the same as value creation. Financing mix, purchase accounting, synergies, interest rates, target earnings quality and new shares can make a deal EPS-accretive while destroying value—or initially dilutive while creating long-term value.
This version focuses on mechanics, computation, evidence and worked examples. For Accretion/Dilution Analysis: Board-Ready Framework with Practical Example, the objective is not to produce a one-line rate or checklist answer. The objective is to make the position reproducible: another reviewer should be able to identify the model decision point, apply the chosen methodology, rebuild the calculation and trace the result into the relevant model output, financial-statement reconciliation or board paper.
What makes this topic difficult?
For Accretion/Dilution Analysis: Board-Ready Framework with Practical Example, the difficult part is linking model purpose and source data to formula architecture and then proving the result through standalone diluted EPS bridge. A commercially similar transaction can produce a different outcome when the profile-specific facts change. The first failure mode to guard against is mixing basic EPS with diluted post-deal share count, so this guide starts with classification and evidence rather than a headline percentage.
2. Current framework — 5 September 2026
Current-position note for Accretion/Dilution Analysis: Board-Ready Framework with Practical Example. This balance batch closes the modeling pillar with contribution margin, operating leverage, merger models, accretion/dilution and synergy modeling. These are decision models, not accounting standards by themselves. Every model should state units, valuation/reference date, scenario assumptions, source data and reconciliation to reported financials. Transaction models should bridge enterprise value to equity value, purchase consideration to funding, share count to EPS and synergy assumptions to implementation timing, tax and one-off costs; outputs should be presented as sensitivities rather than false precision.
Define the reference EPS consistently—basic or diluted, reported or adjusted—and use the same basis pre- and post-deal. This point is the first technical checkpoint because a wrong classification at this stage contaminates every later calculation. For Accretion/Dilution Analysis: Board-Ready Framework with Practical Example, that means the computation file should show the classification step separately from the amount calculation.
Model purchase consideration and funding before calculating EPS; cash-funded, debt-funded and stock-funded deals affect earnings and share count differently. In practice, finance teams often discover this issue only during return preparation or diligence; the better control is to resolve it when the transaction is designed. If the fact changes, the team should rerun the conclusion rather than preserve the old answer for convenience.
Include incremental interest, lost cash income, amortisation/depreciation/PPA effects, transaction/integration costs and tax in the correct periods. The supporting memo should state the factual assumption that makes the rule relevant and identify the document that proves that assumption. The practical consequence is that the same source fact can produce a different legal, tax, accounting or valuation result when the governing classification or measurement basis changes.
Show accretion before and after synergies so the board can see how much of the result depends on execution rather than financing mechanics. A reviewer should be able to reproduce the conclusion from the source records without relying on a management explanation or a spreadsheet note. This is also where audit defence is won: consistent contracts, registers, bank evidence and filed forms are stronger than a later explanatory note.
Pair EPS analysis with ROIC/WACC, free cash flow, leverage and valuation; an EPS percentage alone is not an investment decision. Where a contract, ledger, model or business label uses broad terminology, the analysis should translate it into the topic-specific legal, tax, accounting or valuation concept before applying a rate, formula or filing rule. The article therefore treats this as a decision rule, not as a generic caution.
For Accretion/Dilution Analysis: Board-Ready Framework with Practical Example, where an older accounting policy, transaction assumption, forecast version or valuation methodology is relevant to an earlier period, preserve it in the version history and label it clearly. The current model should not silently mix assumptions from different reference dates.
3. Detailed mechanics
Computation and evidence focus
This version focuses on mechanics, computation, evidence and worked examples. For Accretion/Dilution Analysis: Board-Ready Framework with Practical Example, start with the model purpose, reference date and decision horizon, then build a source-to-output bridge. The computation should show source input, driver, formula, timing, scenario assumption, resulting output and the exact schedule or board metric where the outcome is used.
For Accretion/Dilution Analysis: Board-Ready Framework with Practical Example, a reviewer should be able to select any material number and trace it backwards to the governing methodology, formula and source document. Where the answer is conditional, show both the base case and the fact that would flip the result. This is more useful than a single “applicable/not applicable” conclusion because it tells the finance team what to monitor before approving or using the model.
How the mechanics should be documented
For Accretion/Dilution Analysis: Board-Ready Framework with Practical Example, create an assumption register with seven columns: model driver, reference period/date, source document or system, formula/method, base-case assumption, sensitivity range and owner. This prevents a correct-looking output from being supported by an undocumented assumption or the wrong source period.
For Accretion/Dilution Analysis: Board-Ready Framework with Practical Example, create a reconciliation bridge that begins with the source system or approved forecast and ends with the model or decision output. Differences should be explained, not manually forced to zero. In this article, the bridge may need to distinguish operating forecast, debt and cash-flow schedules, accounting carrying amounts, valuation inputs, enterprise value, equity value and decision-case outputs. The working should state the purpose, date and source of each value so a legitimate difference is not mistaken for an error — and an actual mismatch is not hidden as a “valuation difference”.
Practitioner deep dive — five topic-specific checkpoints
Technical checkpoint 1
Define the reference EPS consistently—basic or diluted, reported or adjusted—and use the same basis pre- and post-deal. For Accretion/Dilution Analysis: Board-Ready Framework with Practical Example, this checkpoint should be resolved before the team moves to "define standalone EPS basis, forecast period and diluted share count". The working paper should identify the exact fact being tested, the date on which that fact is measured, and the source record used to support it. A useful evidence anchor here is standalone diluted EPS bridge. If that record points in a different direction from the spreadsheet or commercial summary, the model classification should be reconsidered before any number is carried into a return, model or decision output.
Computation consequence. The failure mode to test is mixing basic EPS with diluted post-deal share count. Do not solve that risk by inserting a balancing figure. Instead, rebuild the bridge from source fact → applicable rule → amount/character → reporting destination. For Accretion/Dilution Analysis: Board-Ready Framework with Practical Example, the calculation file should preserve both the original source amount and every adjustment, allocation, valuation or classification step applied to it. This lets a reviewer distinguish a genuine legal adjustment from an unexplained spreadsheet difference.
Technical checkpoint 2
Model purchase consideration and funding before calculating EPS; cash-funded, debt-funded and stock-funded deals affect earnings and share count differently. For Accretion/Dilution Analysis: Board-Ready Framework with Practical Example, this checkpoint should be resolved before the team moves to "map consideration and funding mix before calculating post-deal EPS". The working paper should identify the exact fact being tested, the date on which that fact is measured, and the source record used to support it. A useful evidence anchor here is deal consideration/funding schedule. If that record points in a different direction from the spreadsheet or commercial summary, the model classification should be reconsidered before any number is carried into a return, model or decision output.
Computation consequence. The failure mode to test is calling a deal accretive before including financing or PPA effects. Do not solve that risk by inserting a balancing figure. Instead, rebuild the bridge from source fact → applicable rule → amount/character → reporting destination. For Accretion/Dilution Analysis: Board-Ready Framework with Practical Example, the calculation file should preserve both the original source amount and every adjustment, allocation, valuation or classification step applied to it. This lets a reviewer distinguish a genuine legal adjustment from an unexplained spreadsheet difference.
Technical checkpoint 3
Include incremental interest, lost cash income, amortisation/depreciation/PPA effects, transaction/integration costs and tax in the correct periods. For Accretion/Dilution Analysis: Board-Ready Framework with Practical Example, this checkpoint should be resolved before the team moves to "bridge target earnings, financing cost, PPA effects and transaction/integration costs". The working paper should identify the exact fact being tested, the date on which that fact is measured, and the source record used to support it. A useful evidence anchor here is target earnings quality bridge. If that record points in a different direction from the spreadsheet or commercial summary, the model classification should be reconsidered before any number is carried into a return, model or decision output.
Computation consequence. The failure mode to test is using management target earnings without a quality-of-earnings bridge. Do not solve that risk by inserting a balancing figure. Instead, rebuild the bridge from source fact → applicable rule → amount/character → reporting destination. For Accretion/Dilution Analysis: Board-Ready Framework with Practical Example, the calculation file should preserve both the original source amount and every adjustment, allocation, valuation or classification step applied to it. This lets a reviewer distinguish a genuine legal adjustment from an unexplained spreadsheet difference.
Technical checkpoint 4
Show accretion before and after synergies so the board can see how much of the result depends on execution rather than financing mechanics. For Accretion/Dilution Analysis: Board-Ready Framework with Practical Example, this checkpoint should be resolved before the team moves to "calculate pre-synergy and post-synergy accretion/dilution by period". The working paper should identify the exact fact being tested, the date on which that fact is measured, and the source record used to support it. A useful evidence anchor here is PPA/financing cost schedule. If that record points in a different direction from the spreadsheet or commercial summary, the model classification should be reconsidered before any number is carried into a return, model or decision output.
Computation consequence. The failure mode to test is hiding the dependence of accretion on unproven synergies. Do not solve that risk by inserting a balancing figure. Instead, rebuild the bridge from source fact → applicable rule → amount/character → reporting destination. For Accretion/Dilution Analysis: Board-Ready Framework with Practical Example, the calculation file should preserve both the original source amount and every adjustment, allocation, valuation or classification step applied to it. This lets a reviewer distinguish a genuine legal adjustment from an unexplained spreadsheet difference.
Technical checkpoint 5
Pair EPS analysis with ROIC/WACC, free cash flow, leverage and valuation; an EPS percentage alone is not an investment decision. For Accretion/Dilution Analysis: Board-Ready Framework with Practical Example, this checkpoint should be resolved before the team moves to "cross-check EPS with ROIC, leverage, free cash flow and valuation". The working paper should identify the exact fact being tested, the date on which that fact is measured, and the source record used to support it. A useful evidence anchor here is synergy/integration plan. If that record points in a different direction from the spreadsheet or commercial summary, the model classification should be reconsidered before any number is carried into a return, model or decision output.
Computation consequence. The failure mode to test is treating EPS accretion as equivalent to economic value creation. Do not solve that risk by inserting a balancing figure. Instead, rebuild the bridge from source fact → applicable rule → amount/character → reporting destination. For Accretion/Dilution Analysis: Board-Ready Framework with Practical Example, the calculation file should preserve both the original source amount and every adjustment, allocation, valuation or classification step applied to it. This lets a reviewer distinguish a genuine legal adjustment from an unexplained spreadsheet difference.
4. Decision workflow
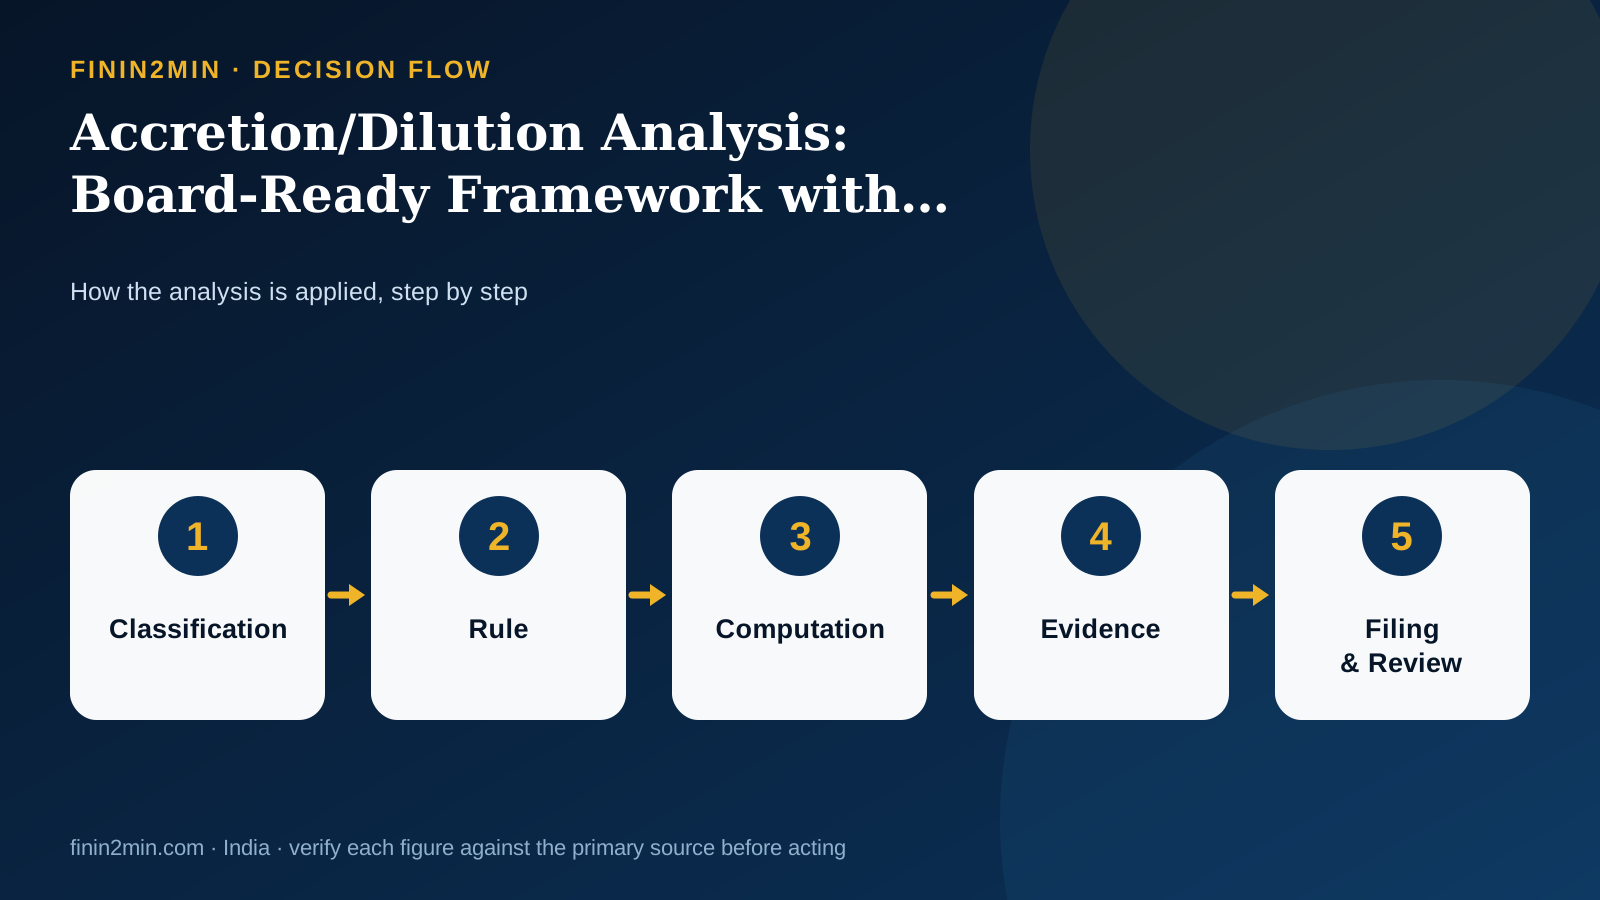
For Accretion/Dilution Analysis: Board-Ready Framework with Practical Example, each workflow step should have a named model and evidence owner. Finance/FP&A may own the source P&L and forecast, treasury may own financing inputs, M&A/strategy may own deal assumptions, and accounting/valuation reviewers may own methodology and reconciliation. Hand-offs and model versions should be recorded because an ownerless spreadsheet is not a control.
5. Worked example
Illustrative worked example
Facts. Buyer earns ₹400 crore on 100 crore diluted shares (₹4 EPS). A deal adds ₹60 crore post-tax target earnings but requires 20 crore new shares and ₹10 crore incremental financing/PPA cost.
Analysis. Post-deal earnings are ₹450 crore on 120 crore shares, or ₹3.75 EPS before synergies—6.25% dilution. A ₹40 crore post-tax synergy would raise EPS to about ₹4.08, but the board should still test whether synergy cost/timing and valuation support the deal.
Finin2min control. This Accretion/Dilution Analysis: Board-Ready Framework with Practical Example example is deliberately simplified. In a live case, replace every illustrative assumption with the actual dates, amounts, classifications, source documents, approvals and filings relevant to this topic before relying on the result.
The Accretion/Dilution Analysis: Board-Ready Framework with Practical Example worked example should be accompanied by a sensitivity note. Identify the profile-specific assumption most likely to change the result and show how the conclusion changes if it moves. The sensitivity should use the actual driver in this article — not a generic market variable — so management can monitor the driver that genuinely changes the model or decision outcome.
6. Scenario analysis
| Scenario | What changes | Reviewer action |
|---|---|---|
| Base case | Core facts align with the intended legal route | Compute and report using the primary rule, with a clear source bridge. |
| Classification changes | One decisive fact changes — instrument, party, project use, resident status or process stage | Re-run the rule before changing only the numeric output. |
| Timing changes | All facts are same but transaction/allotment/default/completion date changes | Re-test the applicable law, rate, deadline and limitation/holding-period consequences. |
| Data mismatch | Commercial report differs from statutory register/return/bank record | Pause filing and reconcile the underlying records first. |
For Accretion/Dilution Analysis: Board-Ready Framework with Practical Example, scenario analysis is a control for model sensitivity and decision uncertainty rather than forecasting theatre. The scenario table should identify the fact that must be watched, the evidence that proves a change, and the action that follows when the fact crosses from the base case into an exception.
7. Documentation and audit trail
Core evidence file
- standalone diluted EPS bridge
- deal consideration/funding schedule
- target earnings quality bridge
- PPA/financing cost schedule
- synergy/integration plan
- ROIC/WACC and EPS sensitivity
Evidence standards
- Use approved source data and executed transaction documents where applicable.
- Preserve the exact model and valuation version actually reviewed or approved.
- Keep system extracts, calculation schedules and approval records—not only screenshots.
- Reconcile dates and periods across source data, forecast, model and decision paper.
- Record reviewer name/date and unresolved assumptions.
- Archive the methodology, source data and sensitivity set relied on.
For material decision-use or transaction Accretion/Dilution Analysis: Board-Ready Framework with Practical Example models, add a version history and an assumption/issues index. The index should state the driver, management assumption, source evidence, sensitivity and owner. This makes board review, diligence and post-deal tracking materially faster.
Evidence-to-conclusion matrix for Accretion/Dilution Analysis: Board-Ready Framework with Practical Example
Use this Accretion/Dilution Analysis: Board-Ready Framework with Practical Example matrix as a file-index template. It links each source record to a process step and a known failure mode, so evidence is collected for a reason rather than archived as an undifferentiated document dump.
| Evidence | Decision step | Reviewer test | Red flag |
|---|---|---|---|
| standalone diluted EPS bridge | define standalone EPS basis, forecast period and diluted share count | Reconcile standalone diluted EPS bridge to the working used for define standalone EPS basis, forecast period and diluted share count; investigate dates, quantities, values and legal status before sign-off. | mixing basic EPS with diluted post-deal share count |
| deal consideration/funding schedule | map consideration and funding mix before calculating post-deal EPS | Reconcile deal consideration/funding schedule to the working used for map consideration and funding mix before calculating post-deal EPS; investigate dates, quantities, values and legal status before sign-off. | calling a deal accretive before including financing or PPA effects |
| target earnings quality bridge | bridge target earnings, financing cost, PPA effects and transaction/integration costs | Reconcile target earnings quality bridge to the working used for bridge target earnings, financing cost, PPA effects and transaction/integration costs; investigate dates, quantities, values and legal status before sign-off. | using management target earnings without a quality-of-earnings bridge |
| PPA/financing cost schedule | calculate pre-synergy and post-synergy accretion/dilution by period | Reconcile PPA/financing cost schedule to the working used for calculate pre-synergy and post-synergy accretion/dilution by period; investigate dates, quantities, values and legal status before sign-off. | hiding the dependence of accretion on unproven synergies |
| synergy/integration plan | cross-check EPS with ROIC, leverage, free cash flow and valuation | Reconcile synergy/integration plan to the working used for cross-check EPS with ROIC, leverage, free cash flow and valuation; investigate dates, quantities, values and legal status before sign-off. | treating EPS accretion as equivalent to economic value creation |
| ROIC/WACC and EPS sensitivity | run interest-rate, target-earnings, synergy and issue-price sensitivities for board review | Reconcile ROIC/WACC and EPS sensitivity to the working used for run interest-rate, target-earnings, synergy and issue-price sensitivities for board review; investigate dates, quantities, values and legal status before sign-off. | failing to show the break-even synergy or target-earnings level |
8. Risk controls and common mistakes
- mixing basic EPS with diluted post-deal share count
- calling a deal accretive before including financing or PPA effects
- using management target earnings without a quality-of-earnings bridge
- hiding the dependence of accretion on unproven synergies
- treating EPS accretion as equivalent to economic value creation
- failing to show the break-even synergy or target-earnings level
Most Accretion/Dilution Analysis: Board-Ready Framework with Practical Example errors are rarely simple arithmetic mistakes. They more often arise from a wrong driver classification, stale forecast, inconsistent reference date, hidden hard-code, double-counted assumption or an output that does not reconcile to source data. Controls should target those model risks rather than merely recalculate the final total.
9. Professional review checklist
- Has model purpose and source data been resolved using the current framework for the actual transaction/process date?
- Can the conclusion be traced to standalone diluted EPS bridge and deal consideration/funding schedule?
- Has the team separately documented formula architecture and valuation/accounting consistency rather than assuming one answers the other?
- Are the dates needed for define standalone EPS basis, forecast period and diluted share count and map consideration and funding mix before calculating post-deal EPS supported by source records?
- Has the specific red flag “mixing basic EPS with diluted post-deal share count” been tested and closed?
- Do the working papers explain any difference among operating forecast, debt and cash-flow schedules, accounting carrying amounts, valuation inputs, enterprise value, equity value and decision-case outputs?
- Are the worked-example assumptions clearly separated from the actual Accretion/Dilution Analysis: Board-Ready Framework with Practical Example fact pattern?
- Has a second reviewer checked the technical conclusion, arithmetic and evidence trail for Accretion/Dilution Analysis: Board-Ready Framework with Practical Example?
For Accretion/Dilution Analysis: Board-Ready Framework with Practical Example, a finance/FP&A expert should review the economics and reconciliation; an accounting, valuation or M&A professional should review methodology and transaction assumptions; and the business owner should confirm that the operating assumptions used in the model are actually achievable. The review is complete only when these perspectives agree on the same dated fact set and unresolved exceptions are explicitly assigned.
10. Frequently asked questions
What is the first question to ask?
Start with model purpose and source data for Accretion/Dilution Analysis: Board-Ready Framework with Practical Example. A commercial label is not enough; identify the parties, the model objective, decision horizon, reference date and governing accounting/valuation context before calculating or presenting an output.
Which framework and sources should be used for a 2026 model?
For Accretion/Dilution Analysis: Board-Ready Framework with Practical Example, This balance batch closes the modeling pillar with contribution margin, operating leverage, merger models, accretion/dilution and synergy modeling. These are decision models, not accounting standards by themselves. Every model should state units, valuation/reference date, scenario assumptions, source data and reconciliation to reported financials. Transaction models should bridge enterprise value to equity value, purchase consideration to funding, share count to EPS and synergy assumptions to implementation timing, tax and one-off costs; outputs should be presented as sensitivities rather than false precision.
Can I rely only on a broker, ERP, portal or consultant report?
No. For Accretion/Dilution Analysis: Board-Ready Framework with Practical Example, secondary reports are useful working evidence, but the final position should reconcile to the profile-specific source file — including standalone diluted EPS bridge, deal consideration/funding schedule — and to the current authoritative methodology or source framework.
What if two values are different?
For Accretion/Dilution Analysis: Board-Ready Framework with Practical Example, do not force them to match. First identify whether they answer different questions. In this pillar, the relevant bridge may involve operating forecast, debt and cash-flow schedules, accounting carrying amounts, valuation inputs, enterprise value, equity value and decision-case outputs. Label each value by purpose, valuation date and source, then document why the difference is legitimate or what correction is required.
What is the biggest practical error?
mixing basic EPS with diluted post-deal share count. The remedy is to resolve the classification and evidence before approving or using the model.
How should I prepare for scrutiny or diligence?
For Accretion/Dilution Analysis: Board-Ready Framework with Practical Example, maintain a dated technical memo and a file index that includes standalone diluted EPS bridge, deal consideration/funding schedule, target earnings quality bridge. Preserve the calculation version, reviewer sign-off and the reconciliation from those source records to the model, board paper, valuation memo or financial-statement reconciliation that uses the conclusion.
Should the example be copied into my return or model?
No. The Accretion/Dilution Analysis: Board-Ready Framework with Practical Example example demonstrates mechanics only. Replace each assumption with the actual dates, status, amounts and documents in your case, and re-check the current rule before using the result in a model, board paper, valuation memo or decision pack.
When should the analysis be refreshed?
Refresh the Accretion/Dilution Analysis: Board-Ready Framework with Practical Example analysis whenever a fact affecting model purpose and source data, formula architecture or valuation/accounting consistency changes, or when the accounting/valuation framework, approval status, reference date, forecast or source evidence is updated.
11. Sources and validation basis
This article is anchored to primary or authoritative material. Always check later amendments, notifications, circulars and transaction-specific facts before acting.
Disclaimer: This Accretion/Dilution Analysis: Board-Ready Framework with Practical Example guide is for general educational information and does not constitute legal, tax, accounting, investment or financial advice. Transaction-specific positions may differ based on facts, dates, jurisdiction, documentation and later amendments. Obtain professional advice before acting.