Indian Stocks Rebound as Oil Eases, but US Inflation and Global AI Risks Persist
Indian market close 29 October · Global markets through early 30 October 2026 IST
On 29 October, Indian equities staged a broad rebound, even as the global economy sent a more complicated message: strong US growth, elevated consumer inflation, falling technology shares and crude oil still above $110 a barrel. This edition explains the numbers, the transmission to Indian households and businesses, and the tax, legal and regulatory events that demand attention.
2-Minute Summary
- Indian equities rebounded decisively: Nifty 50 rose 237.90 points to 22,936.75; Sensex added 905.01 to 74,151.04. The gains extended to mid-caps and small-caps, rather than being confined to a handful of index heavyweights.
- Brent crude settled at $114.88 a barrel and WTI at $102.00. Renewed diplomatic discussion lowered the risk premium, but threats to Gulf energy infrastructure and shipping kept markets nervous.
- Spot gold stood at $4,008.76 per troy ounce and spot silver at $52.08 at 18:09 UTC on 29 October. Rising inflation expectations and possible US monetary tightening weighed on non-yielding metals.
- GIFT Nifty futures were quoted at 23,066.00, up 23.50 points against their own previous futures reference, at 01:03 IST on 30 October. This is an overnight futures indicator rather than the Indian cash-market closing price.
- The US economy grew at a 3.4% annualised rate in Q3 2026, versus 2.2% in Q2. September headline PCE inflation reached 3.6% year-on-year and core PCE reached 3.1%.
- The Fed held its target at 3.75%-4.00%, and the ECB also kept rates unchanged. Both central banks signalled sensitivity to elevated inflation and energy costs.
- MoSPI published a trial services-output index: 17 of 19 measured sub-sectors grew year-on-year in August; retail trade rose 19.9%, insurance 16.5%, and banking 14.9%.
- For businesses, the immediate calendar includes Q2 tax-deduction statements on 31 October, specific GST changes taking effect on 1 November and the MCA annual filing relief for FY 2025-26.

Markets at a Glance
| Instrument | Level | Move | As-of |
|---|---|---|---|
| Nifty 50NSE cash close | 22,936.75 | +1.05% | 2026-10-29 15:30 IST |
| BSE SensexBSE cash close | 74,151.04 | +1.24% | 2026-10-29 15:30 IST |
| Nifty BankNSE cash close | 54,909.65 | +1.18% | 2026-10-29 15:30 IST |
| Nifty Midcap 100NSE cash close | 57,841.65 | +0.99% | 2026-10-29 15:30 IST |
| FII cash netNSE provisional cash | -₹943.60 cr | — | 2026-10-29 post-close IST |
| DII cash netNSE provisional cash | +₹1,924.41 cr | — | 2026-10-29 post-close IST |
| Brent futuresBrent futures settlement | $114.88/bbl | -0.38% | 2026-10-29 US settlement |
| WTI futuresWTI futures settlement | $102.00/bbl | -0.76% | 2026-10-29 US settlement |
| Spot goldinternational spot observation | $4,008.76/oz | -1.4% | 2026-10-29 18:09 UTC |
| Spot silverinternational spot observation | $52.08/oz | -3.5% | 2026-10-29 18:09 UTC |
| GIFT Nifty futuresindicative futures quote; contract/venue basis differs from cash | 23,066.00 | +0.1% | 2026-10-30 01:03 IST |
| USD/INRinterbank close | ₹95.26/USD | — | 2026-10-29 India close |
| India 10-year government bond yieldgovernment bond yield close | 7.35% | — | 2026-10-29 India close |
| US S&P 500US cash close | 7,720.39 | -0.3% | 2026-10-29 NYSE close |
| US Dow JonesUS cash close | 52,342.56 | -0.3% | 2026-10-29 NYSE close |
Indian equities: a broad recovery, not only a headline bounce
MARKETSThe Nifty 50 closed at 22,936.75, up 237.90 points or 1.05%; the BSE Sensex ended at 74,151.04, a gain of 905.01 points or 1.24%. Both benchmarks had been under pressure as expensive imported crude and weaker technology sentiment hurt valuations. Thursday’s gains were therefore a recovery from a difficult run, not proof that every underlying risk had disappeared.
The rally covered 15 of 16 major sectors. Financials, IT, power, consumer businesses and realty participated, while the Nifty Midcap 100 advanced 0.99% and the Nifty Smallcap 100 gained 0.95%. Bank Nifty finished at 54,909.65, up 1.18%. A rise across large and smaller companies generally provides a stronger breadth signal than one driven entirely by the largest constituents.
Adani Ports and Adani Enterprises were among the prominent gainers after company earnings. Kotak Mahindra Bank, Power Grid and large consumer names also advanced. At the same time, the latest price move should be viewed with the context of recent volatility: the direction of oil, bond yields and quarterly profit margins still influences whether the improvement can persist.
For portfolio reviews, separate index direction from portfolio-level participation. A large-cap benchmark can rise while a concentrated small-cap portfolio behaves differently, and a single strong day is not a substitute for earnings, leverage and valuation analysis.
Foreign selling met domestic buying: what the flows show
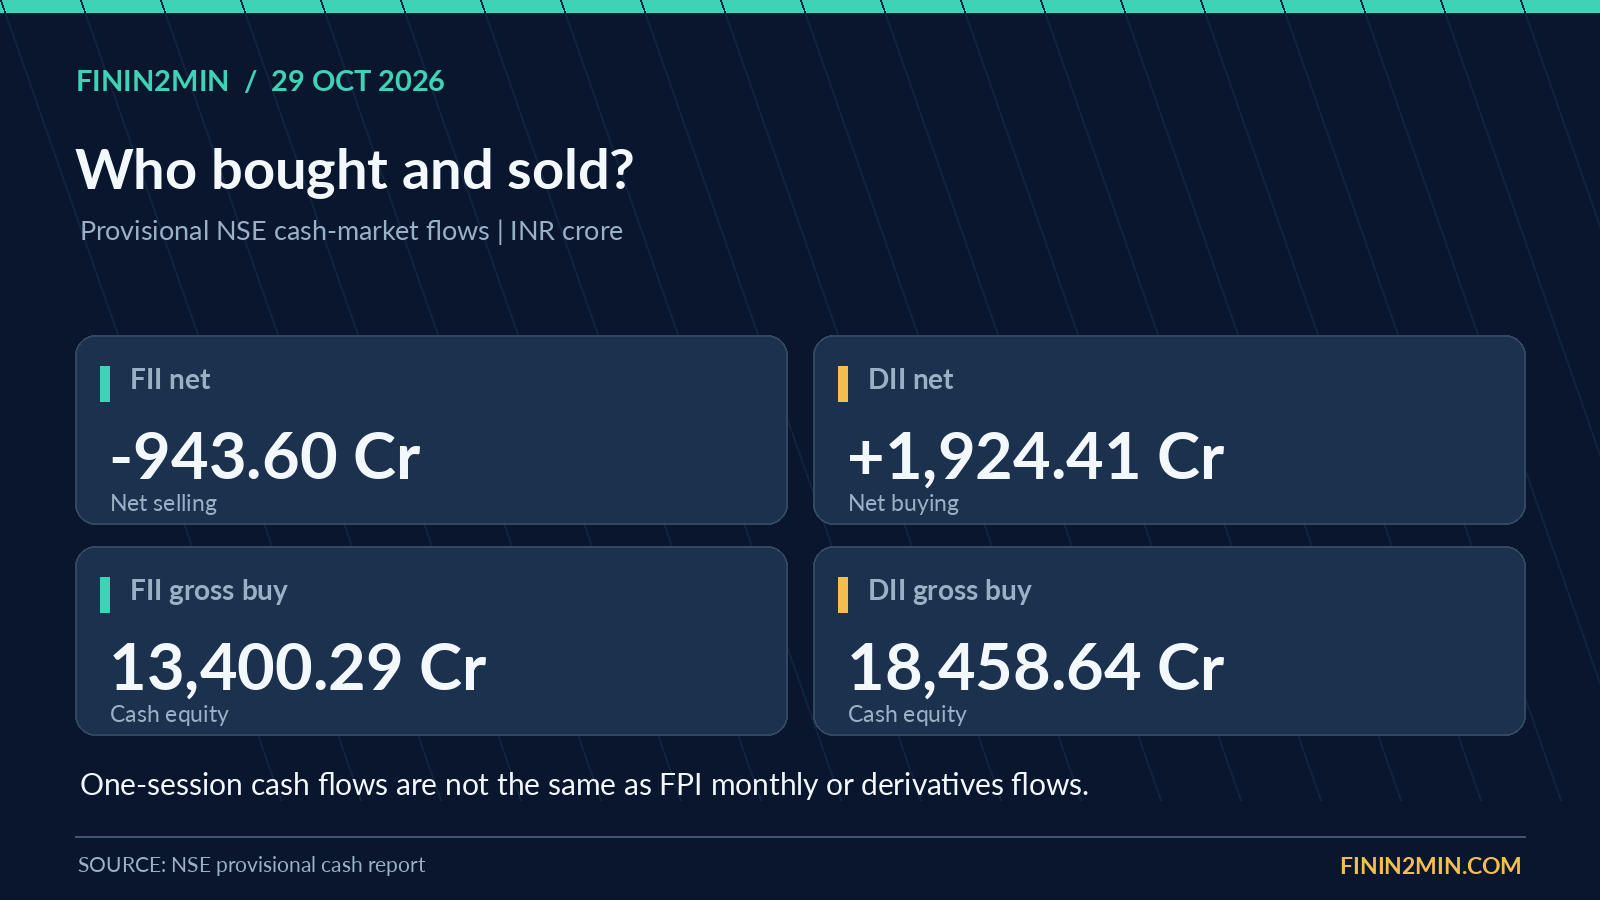
MARKETSProvisional exchange cash-market data for 29 October show FIIs as net sellers of ₹943.60 crore and domestic institutions as net buyers of ₹1,924.41 crore. Foreign gross purchases were ₹13,400.29 crore against sales of ₹14,343.89 crore; domestic institutions purchased ₹18,458.64 crore and sold ₹16,534.23 crore.
This pattern matters because institutional participation is not synonymous with daily market direction. Prices can rise despite FII selling when domestic funds, retail investors and other participants absorb supply. Conversely, one-day institutional buying does not necessarily mean a durable change in the month-long trend.
The cash-market figures are provisional and should not be mixed with NSDL monthly foreign-portfolio totals or derivatives positioning. An institutional investor can reduce exposure in equity cash while separately taking a futures position. The relevant risk monitor is the sustained pattern across sessions, viewed alongside market breadth and the rupee.
Crude oil: diplomacy eases prices, but the supply-risk premium stays
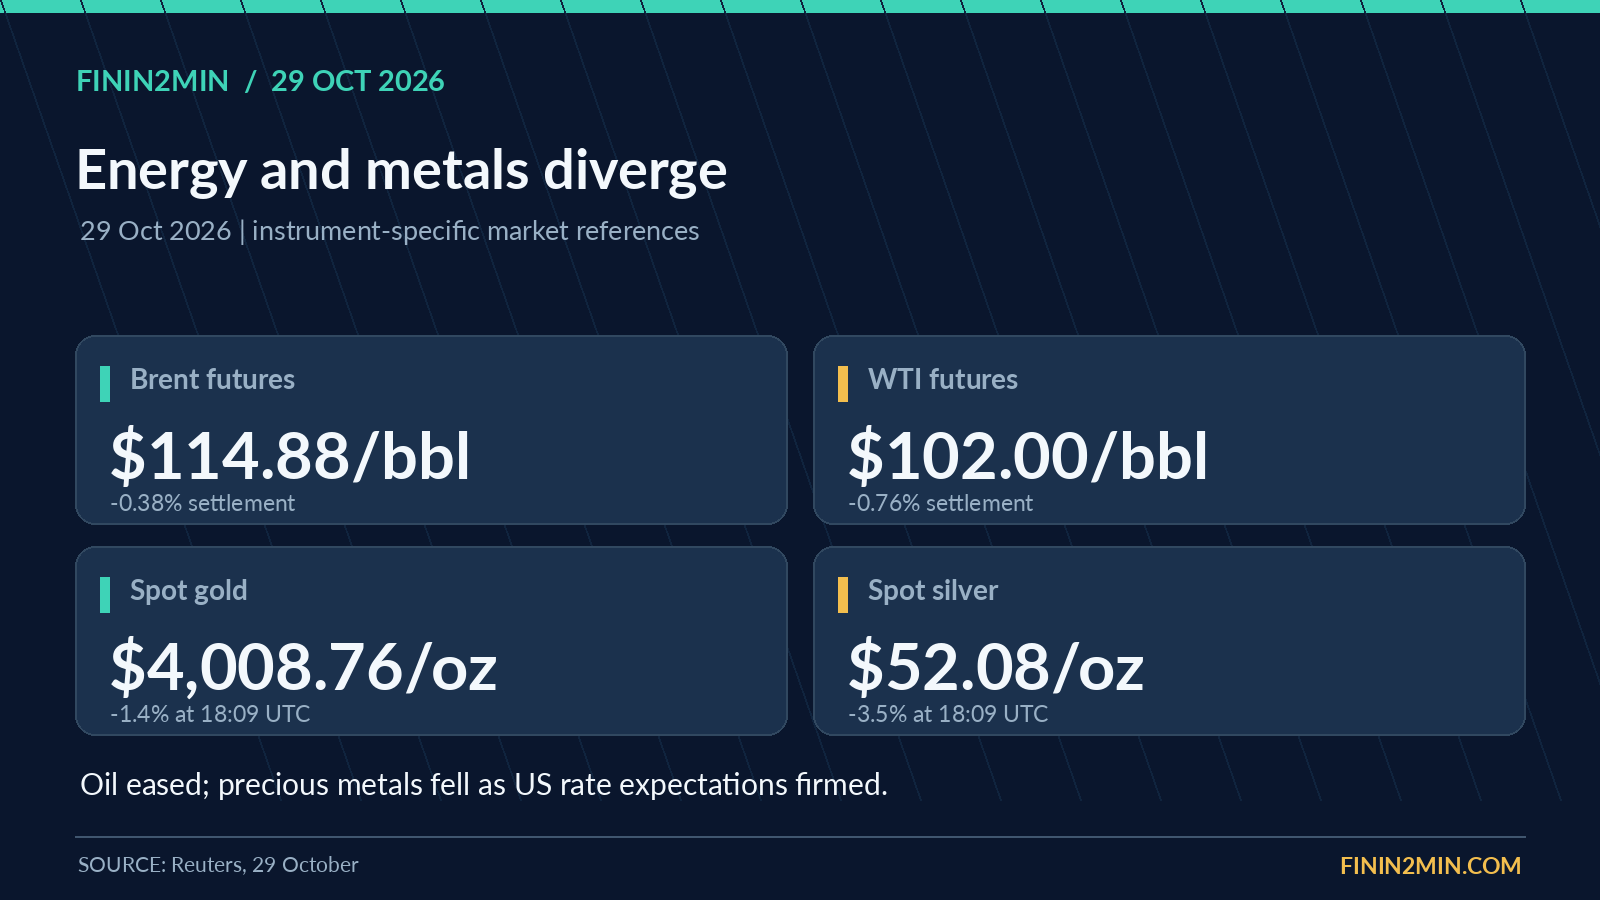
ENERGYBrent crude futures settled 44 cents lower at $114.88 a barrel, a 0.38% decline. US WTI settled 78 cents lower at $102.00, down 0.76%. Both contracts had traded more than $2 lower intraday before recovering some losses, illustrating how quickly energy markets reacted to competing geopolitical signals.
Renewed US-Iran diplomatic contact, including mediation efforts involving Qatar, encouraged traders to reassess the immediate probability of supply disruption. At the same time, the conflict around the Strait of Hormuz and reported threats to Saudi oil infrastructure supported the remaining risk premium. Reports of attacks should not be confused with independently established production losses; physical output, tanker movement and insurance costs ultimately determine the economic impact.
India imports a large portion of its crude requirements. Persistently high Brent prices can raise the landed oil bill, put pressure on refining and marketing economics, increase airline and freight expenses and complicate inflation management. The translation into retail fuel prices is not automatic: taxes, inventory, administered pricing and company margins affect the timing.
For businesses, a practical control is to run cost scenarios with crude and the rupee together. A dollar-denominated oil price can decline while the rupee weakens; in such a case, rupee-denominated import costs may fall far less than the headline Brent move suggests.
Gold and silver retreat as the inflation-and-rates equation changes
METALSInternational spot gold was quoted at $4,008.76 per troy ounce at 18:09 UTC on 29 October, down about 1.4% at that observation. Spot silver stood near $52.08 per ounce, down about 3.5%. December COMEX gold futures settled at $4,031.40, a distinct futures measure that should not be compared with spot without identifying the contract.
The immediate driver was an inflation signal that strengthened expectations of a possible future US rate increase. Higher expected rates lift the opportunity cost of holding non-yielding bullion. A firmer dollar can also change international precious-metal demand because gold is generally priced in US dollars.
Silver can move more sharply than gold because it combines investment demand with industrial uses in solar panels, electronics and manufacturing. A safe-haven explanation alone is insufficient to understand a pronounced silver movement. In India, local gold and silver prices additionally reflect USD/INR, import duties, domestic premiums and GST where applicable.
Investors comparing sovereign gold bonds, ETFs and physical metal should distinguish market price movements from tax treatment, storage costs, fund expenses and bond-specific redemption mechanisms. Daily price volatility by itself does not settle the suitability of one instrument over another.
GIFT Nifty: overnight futures provide a reference, not a guaranteed opening
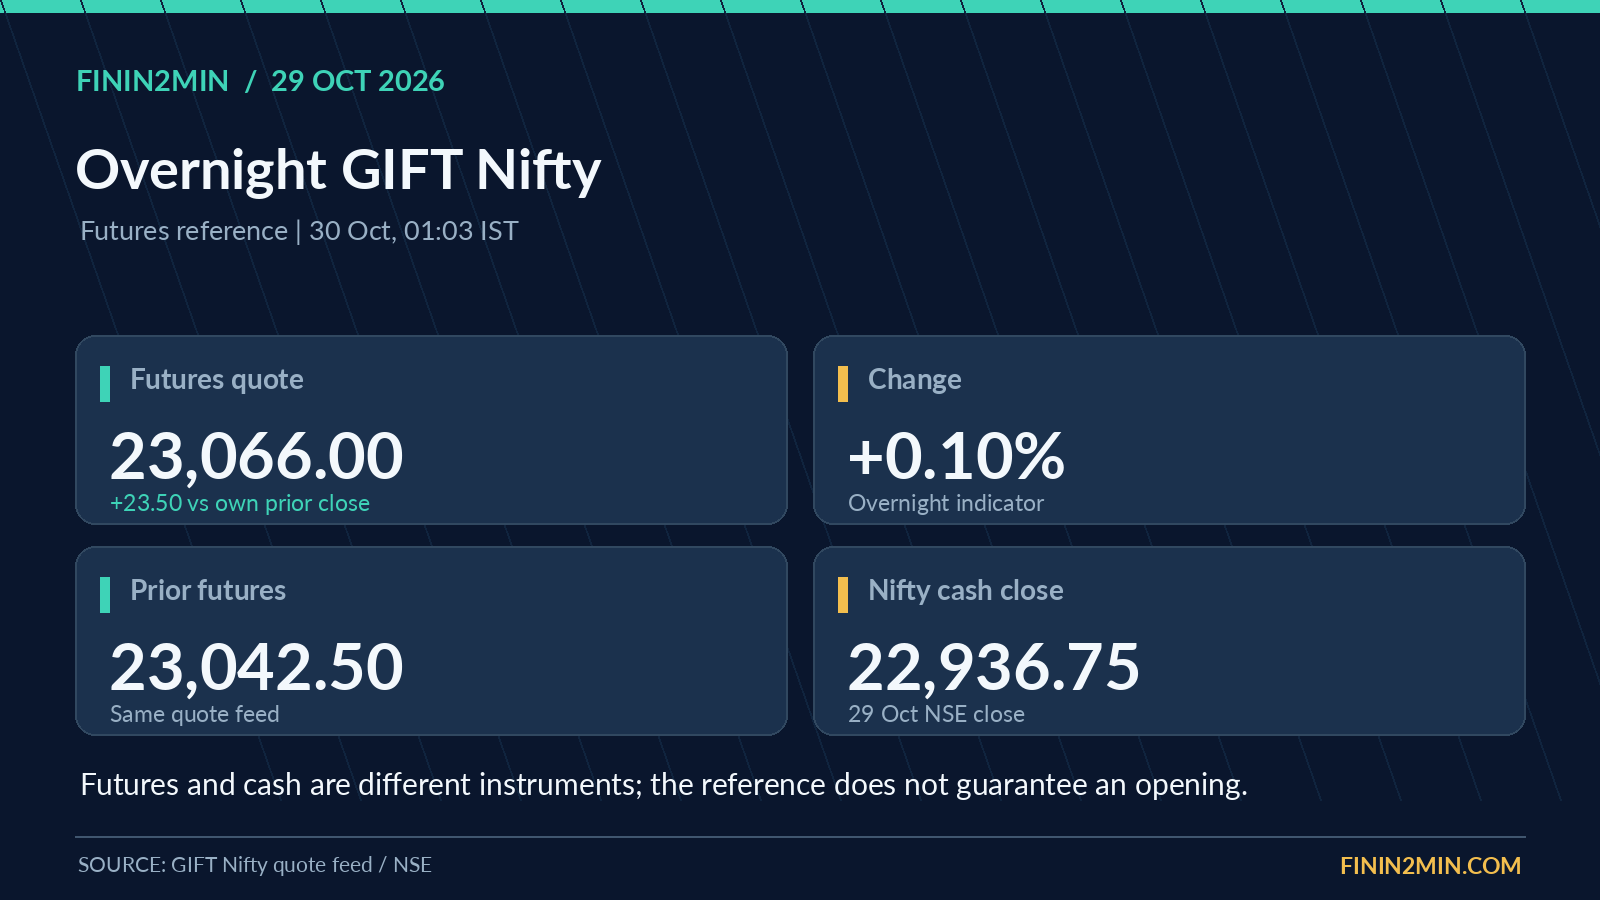
DERIVATIVESGIFT Nifty futures were quoted at 23,066.00 at 01:03 IST on 30 October, up 23.50 points or 0.10% against that feed’s own previous futures close of 23,042.50. The observation belongs to the overnight futures session following the Indian cash-market close.
An offshore futures price reflects expected index exposure, financing, dividends, contract expiry and current global information. It is not identical to Nifty cash, and the gap between the two should not be described as a certain next-day opening move.
For the next Indian session, check whether overnight US technology selling and elevated crude prices offset Thursday’s domestic earnings-led recovery. Observe the latest futures quotation again closer to the Indian open, but compare each contract with its own prior settlement rather than mechanically subtracting the cash close.
Rupee, bond yields and the import-cost transmission
FX & RATESThe rupee ended Thursday around ₹95.26 per US dollar, compared with ₹95.22 a day earlier, after recovering from an intraday low. Lower oil prices later in the session and market expectations of RBI dollar supply helped stabilise trading. India’s ten-year government bond yield was reported near 7.35%.
The rupee and government bond market respond to several common forces: crude import demand, foreign capital flows, the US dollar, inflation expectations and domestic liquidity. A higher bond yield raises the market cost of long-term borrowing; the change does not instantly alter every floating-rate loan but can transmit through benchmark funding costs over time.
Importers should monitor the rupee value of dollar payables and maturity concentration. Exporters with dollar receivables face the reverse exposure. Neither side should treat one favourable day as eliminating a structural currency risk, and hedging must be aligned to actual documented exposures rather than speculative views.
The US Federal Reserve holds rates at 3.75%-4.00%
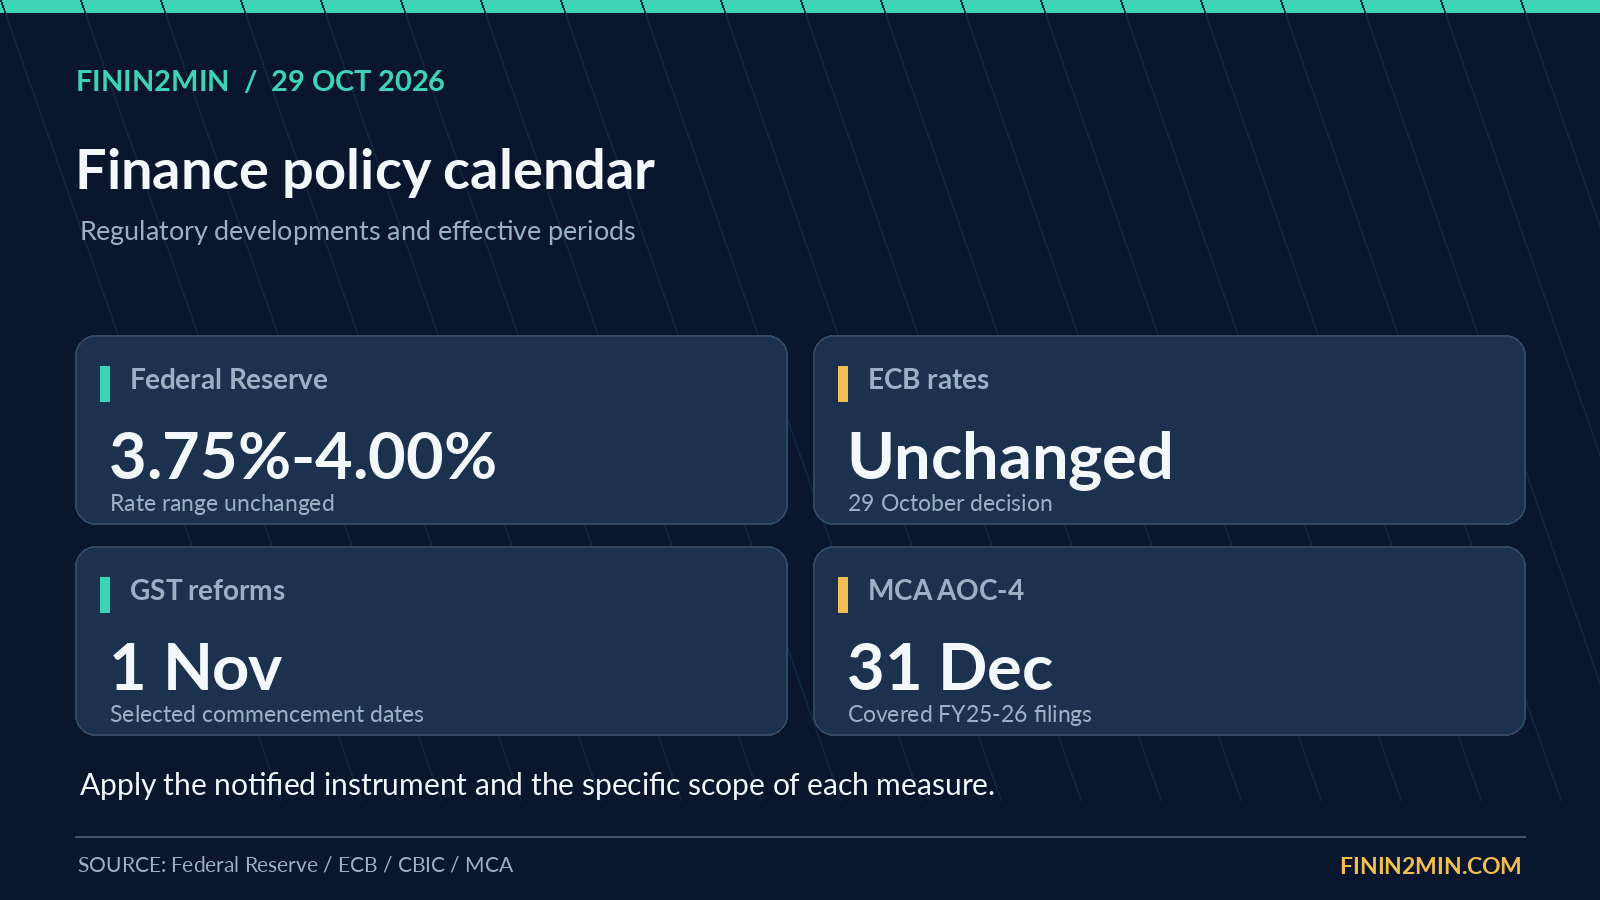
GLOBAL POLICYAt its 27-28 October meeting, the Federal Open Market Committee maintained the target federal funds rate at 3.75%-4.00% by a 10-2 vote. Two members preferred a quarter-percentage-point increase. The official statement described activity as expanding strongly, while inflation remained elevated.
This matters for India through global bond yields, the appeal of dollar assets, the exchange rate and foreign portfolio allocations. When US interest rates stay high, the relative attractiveness of emerging-market bonds and equities can change, although other drivers such as earnings growth and domestic savings remain important.
The Fed did not commit to a predetermined December decision. Businesses should therefore avoid treating a single market-implied probability as a policy guarantee. The more relevant signposts are incoming inflation, employment, growth and energy-price data, as well as the next official Fed statement.
US GDP is strong, but PCE inflation is still elevated
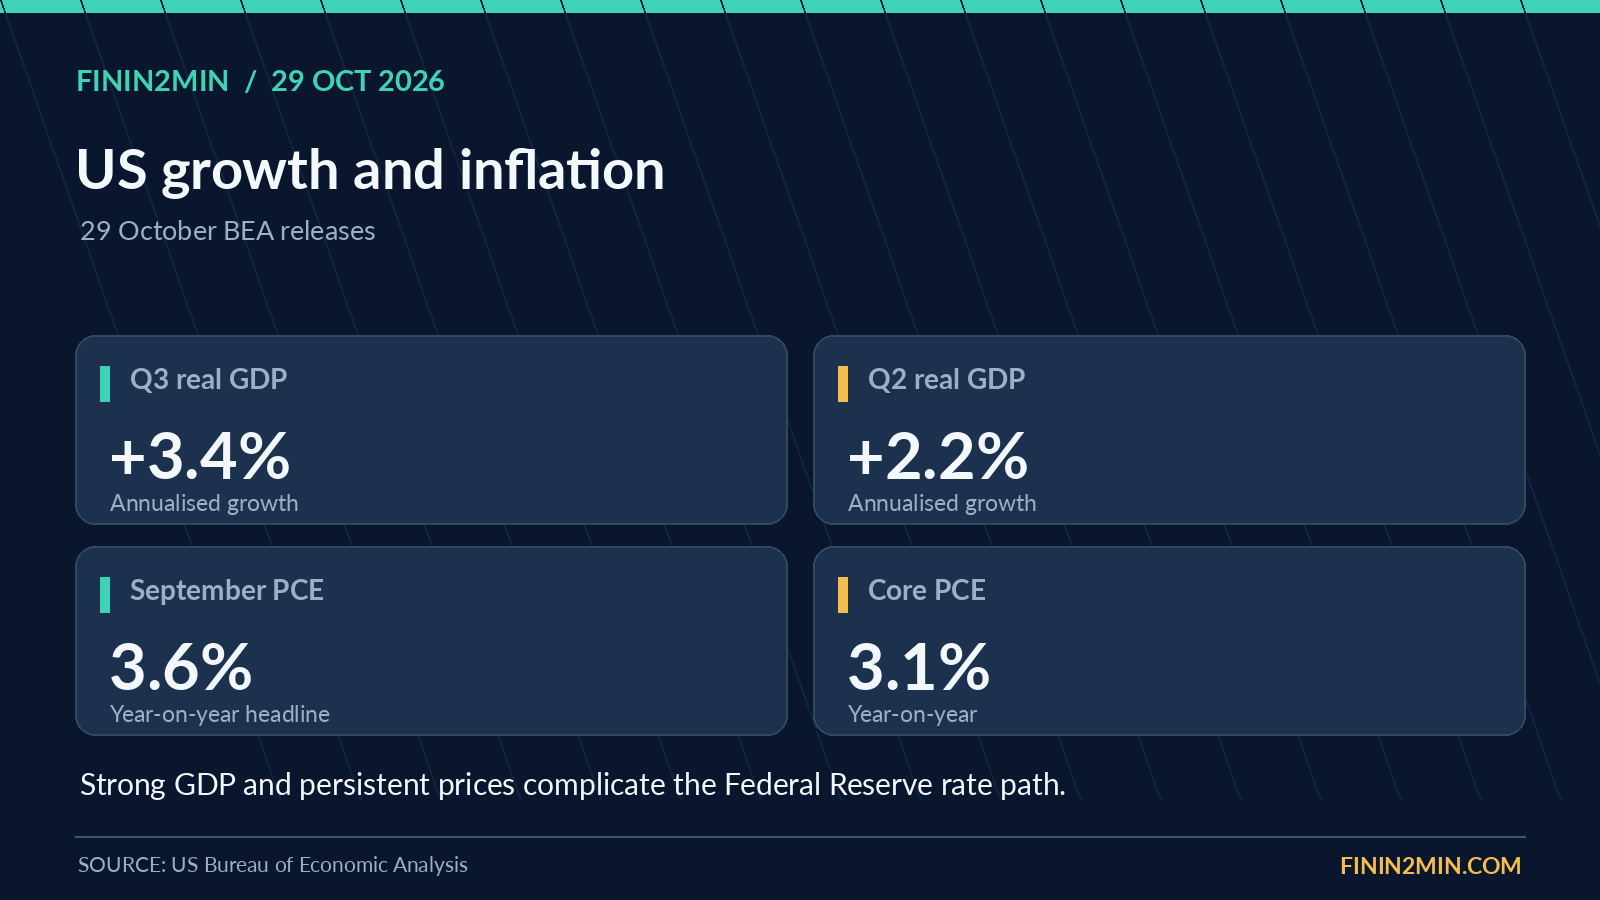
GLOBAL MACROThe US Bureau of Economic Analysis reported third-quarter real GDP growth at a 3.4% annualised rate, up from 2.2% in Q2. Investment, consumer spending and government spending supported the advance estimate, while weaker exports partly offset the gains.
The same day, BEA reported September headline PCE inflation at 3.6% year-on-year and core PCE at 3.1%. The monthly headline PCE price index increased 0.5%, and the core index rose 0.3%. Current-dollar personal spending increased 0.5%, while real spending was essentially flat.
These releases create a difficult balance for the Fed. Strong activity argues against an urgent response to slowing growth, but higher prices complicate a quick move to easier monetary policy. For India, the transmission is visible in dollar yields, international commodity pricing, technology-sector valuations and portfolio flows.
For analysts, distinguish the annualised quarterly GDP rate from year-on-year growth, and the monthly PCE change from the year-on-year inflation rate. They answer different questions and should not be presented interchangeably.
Wall Street: AI investment scrutiny weighs on technology stocks
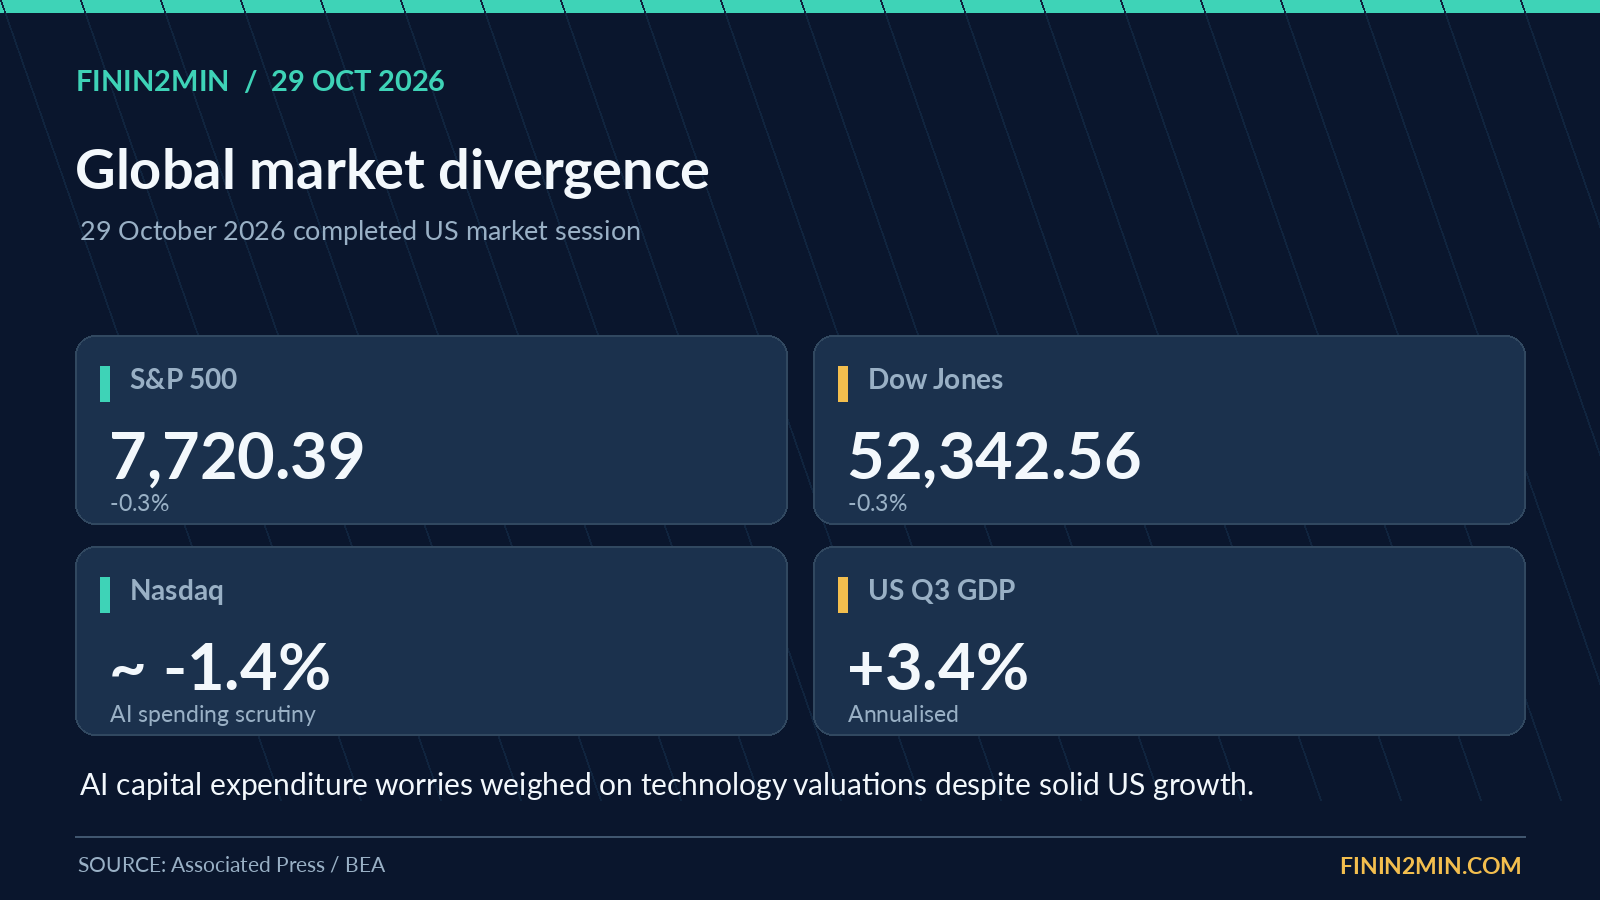
GLOBAL MARKETSIn the completed Thursday US cash session, the S&P 500 slipped approximately 0.3% to 7,720.39 and the Dow Jones Industrial Average fell about 0.3% to 52,342.56. Technology-heavy indices performed worse, with the Nasdaq down about 1.4%, as investors reassessed very large AI infrastructure budgets and company earnings.
The concern was not necessarily that demand for AI services had disappeared. Instead, investors questioned how quickly expensive data-centre, computing and energy investments would convert into cash flows and sustainable returns. A business can report revenue growth while its share valuation falls if capital spending or profit expectations are less favourable than expected.
Indian IT-services firms are exposed indirectly through global corporate technology spending, discretionary projects and client financial conditions. Hardware, power, semiconductor and data-centre businesses have different exposures. Avoid assuming that every Indian technology stock should move in line with one US platform company.
European Central Bank keeps rates steady amid energy risks
GLOBAL POLICYThe European Central Bank left its three policy rates unchanged on 29 October. Its statement highlighted the risk that a persistent energy shock could increase inflation while weakening growth and financing conditions.
For Indian exporters, European industrial activity influences demand for engineering goods, chemicals, textiles and other products. For borrowers, changes in European financing conditions can affect cross-border credit appetite. Energy prices are therefore relevant not only to domestic inflation but also to trade demand and global capital availability.
The ECB emphasised a meeting-by-meeting approach. A policy pause is not an assurance that the next move will be a cut or that monetary conditions have permanently stabilised.
India services activity: retail, insurance and banking lead the trial index
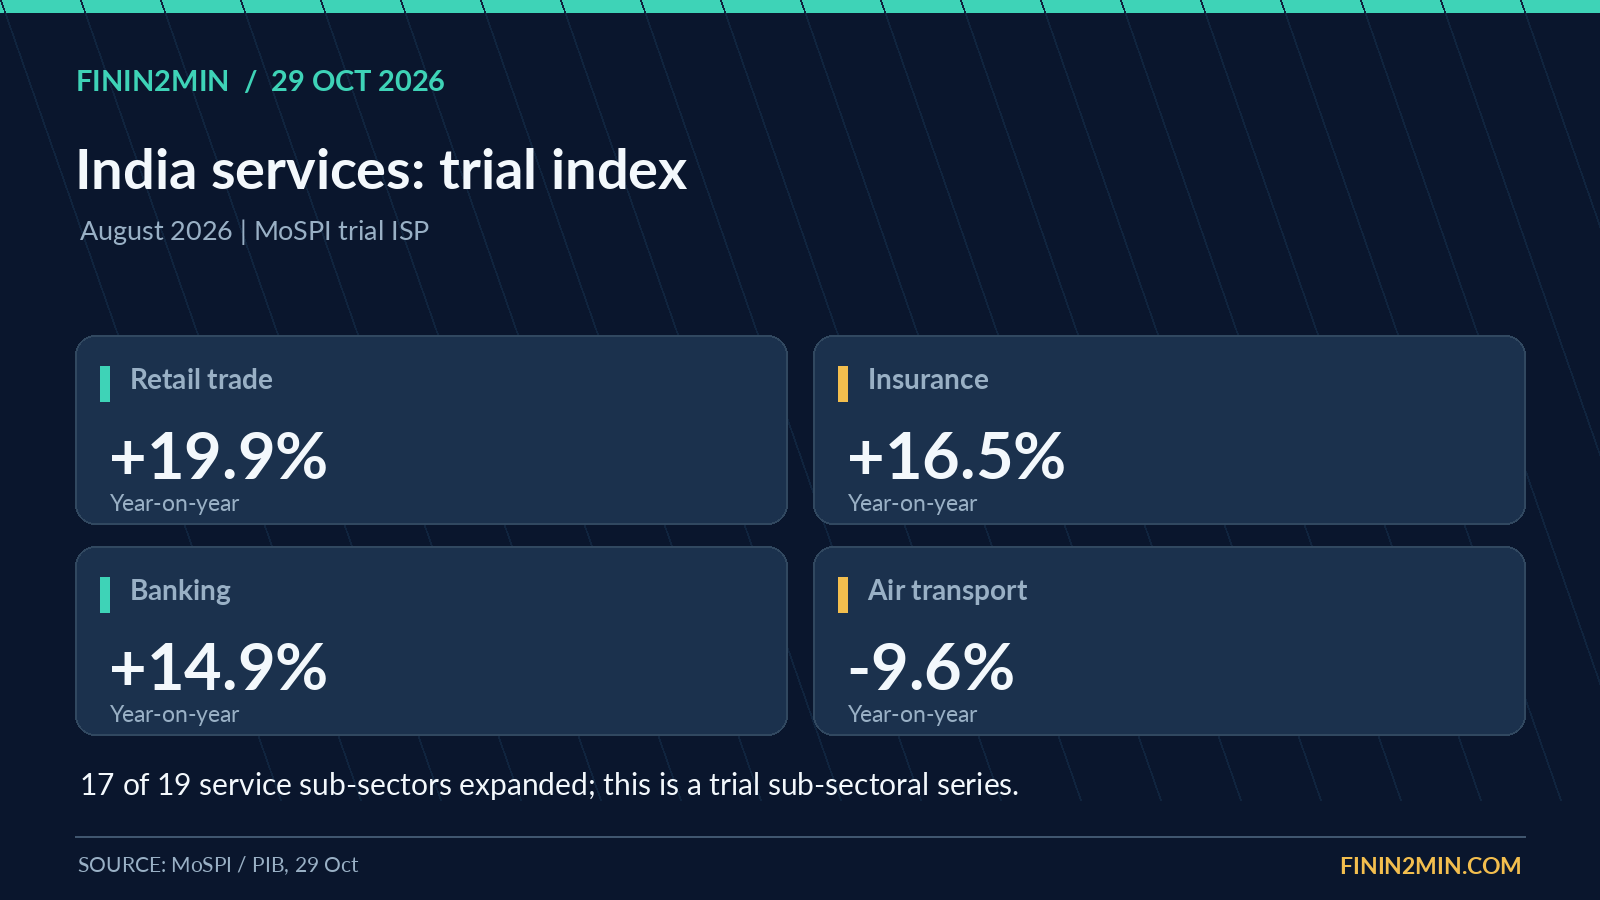
INDIA ECONOMYOn 29 October, MoSPI published its trial Index of Services Production for August 2026, covering 19 services sub-sectors with base year 2024-25. Seventeen sub-sectors showed positive year-on-year growth, and 13 recorded double-digit gains.
Retail trade was up 19.9%, repair services and real estate each 17.6%, insurance 16.5%, banking 14.9% and IT/computer services 13.8%. Air transport contracted 9.6% and arts, entertainment and recreation declined 4.7%. The uneven transport pattern is relevant for interpreting costs, tourism and logistics activity.
This release is a trial sub-sectoral series rather than a single headline services-sector GDP growth rate. It is useful as an additional activity indicator, especially when read with company revenue, credit, tax collections and employment signals, but should not be directly substituted for national accounts.
For MSMEs, the practical lesson is that national-level expansion may coexist with weakness in a particular sub-sector. Revenue and cash-flow planning should use the specific industry, order backlog, customer payment cycles and working capital data.
September industrial production and the manufacturing backdrop
INDIA ECONOMYIndia’s September 2026 industrial production increased 6.7% year-on-year according to the release issued on 28 October. Manufacturing and electricity contributed to the improvement, but the composition of output matters more than the headline rate alone.
Industrial production is a volume indicator, not a direct measure of profitability. An industrial company may produce more while earning lower operating margins if oil, energy or imported components have risen in cost. Manufacturing companies should monitor order growth, operating utilisation, raw material inventory and receivable days together.
The next official IIP release and GDP data will help distinguish temporary output variation from a sustained investment cycle. For finance teams, greater production is most valuable when cash conversion and working-capital funding remain healthy.
Adani Ports earnings: cargo and logistics growth support the stock
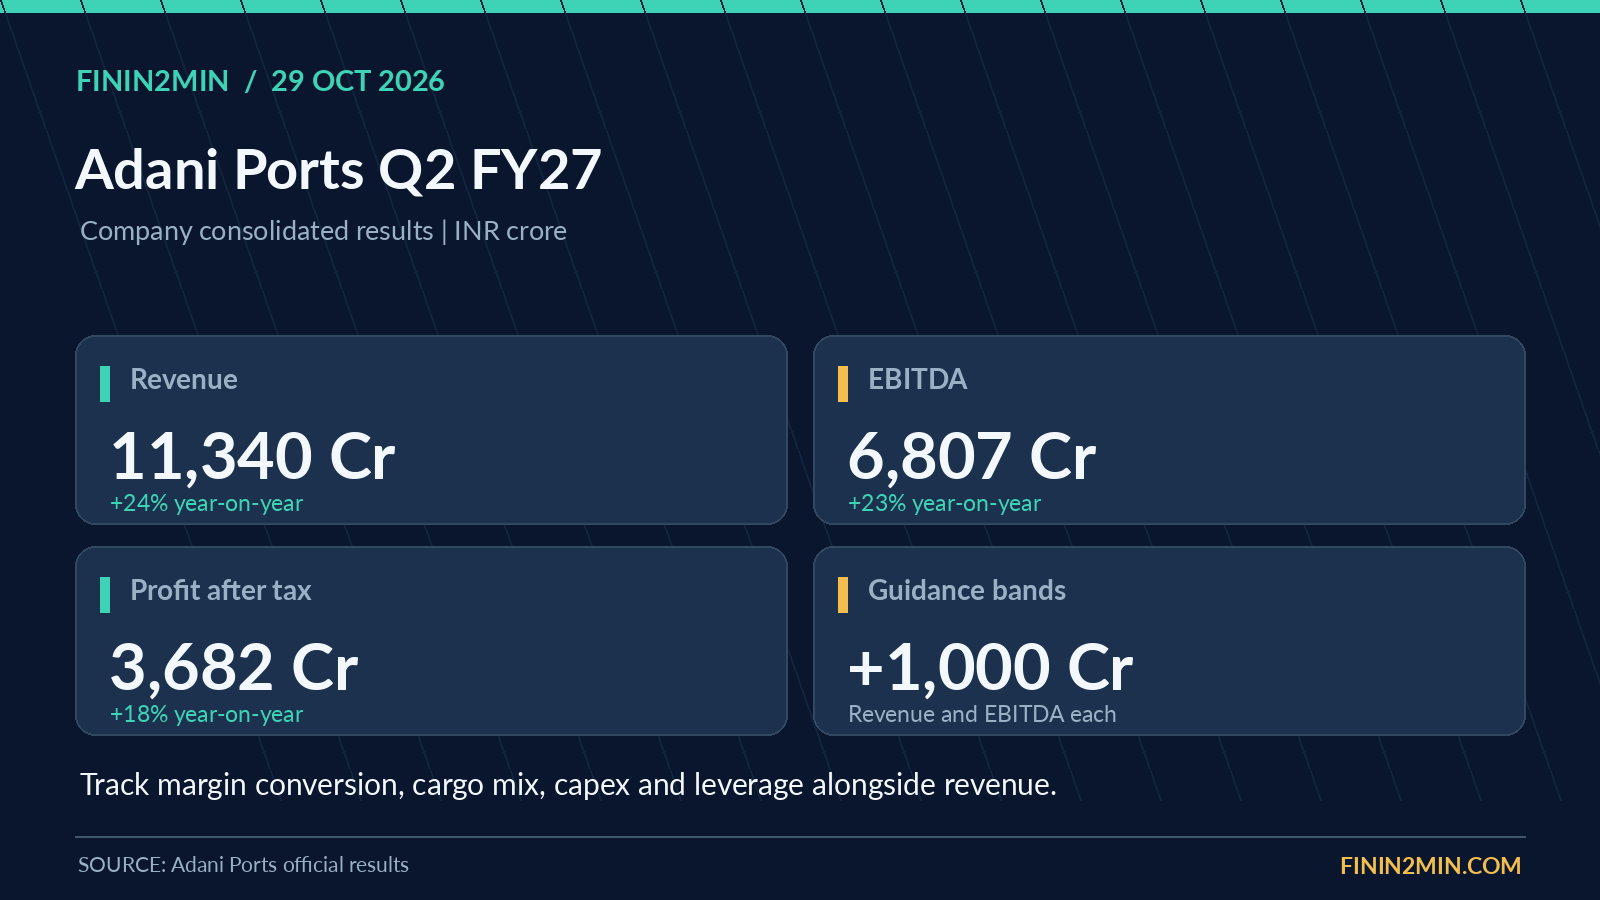
CORPORATEAdani Ports and Special Economic Zone reported Q2 FY27 consolidated revenue of ₹11,340 crore, up 24% year-on-year; EBITDA of ₹6,807 crore, up 23%; and profit after tax of ₹3,682 crore, up 18%. The company also increased its FY27 revenue and EBITDA guidance bands by ₹1,000 crore each.
The distinction between revenue, EBITDA and profit matters. EBITDA growth can support operational momentum, while finance costs, depreciation, taxation and non-operating items influence the final profit. Investors should examine segment margins, domestic and international cargo mix, logistics expansion and capital spending along with the headline numbers.
The ports and logistics sector is exposed to international trade volumes, freight conditions and industrial demand. A business with diversified services may have more than one source of growth, but new capital projects also require monitoring of execution and debt metrics. Company guidance is a projection, not a reported financial result.
Jio Platforms and Reliance: why subsidiary performance needs separate analysis
CORPORATEFollowing Jio Platforms’ listing on 28 October, investors continued to evaluate the relationship between the listed digital business and its parent, Reliance Industries. A strong subsidiary listing can improve visibility of the value attributable to that business while simultaneously prompting changes in how investors price the parent’s remaining exposures.
A parent-company equity valuation should not simply be added to the entire subsidiary market capitalisation without taking ownership percentages and minority interests into account. The key drivers also differ: a digital platform is sensitive to telecom cash flow, subscriber economics, capital expenditure and technology valuations, while the parent retains exposure to energy, retail, financing and other investments.
For investors looking at such a structure, focus on ownership percentage, consolidated cash flows, inter-company transactions, capital allocation and any implications for free float. One day’s share-price divergence is not sufficient to establish that market value has been created or destroyed on a consolidated basis.
Banking and liquidity: lower bond yields do not remove funding pressure
RBI & BANKINGIndian bank shares participated in the 29 October rebound, while the ten-year sovereign yield eased toward 7.35%. The relevant banking questions remain funding costs, the pace of credit and deposit growth, deposit mix, stressed-asset formation and loan pricing.
Higher global rates and imported inflation can prolong pressure on wholesale funding. Banks with larger low-cost current and savings account balances may have different economics from those relying more heavily on term deposits or market borrowing. A market recovery can improve equity valuations without instantly changing asset quality or net interest margins.
Borrowers should review reset clauses, working-capital limits and cash-flow buffers rather than inferring cheaper credit from a single bond-yield decline. A liquidity buffer and covenant monitoring are especially important where sales cycles or import costs are volatile.
GST changes approaching on 1 November: map the transaction first
GST / INDIRECT TAXThe 57th GST Council made extensive recommendations concerning input tax credit, refunds, exports, discounts and compliance. Some measures have notified commencement dates, while other recommendations depend on further legislative or rule-making steps. Tax teams must apply the operative provision to the particular transaction and relevant tax period.
For post-supply discounts and credit-note adjustments, review the terms of the original commercial arrangement, the evidence of discount, tax treatment and corresponding recipient-side credit impact. A commercial credit note and a GST tax credit note do not necessarily have identical tax effects.
For refund claims, classify whether the claim concerns zero-rated supply, inverted duty structure, input services or capital goods. Different effective dates and transitional conditions can apply. Businesses should not assume that all proposed ITC or refund relaxations become available in a single step on 1 November.
The practical action is to update the transaction matrix, ERP tax codes, document formats, contractual clauses and review controls. Have a tax specialist cross-check the notified provisions where the supply spans old and new periods.
CBIC clarifications: registration, ISD, export receipts and appeals
GST / INDIRECT TAXThe CBIC issued a group of GST clarifications in late October covering registration applications, demand and appeal procedures, the pre-deposit mechanism, input service distributor issues, specified input-tax-credit questions and receipt of export proceeds. A separate services clarification addresses matters including R&D grants, transport and financial-sector arrangements.
For businesses, the most useful approach is to match each circular to the exact issue in dispute. A circular addressing procedural uniformity does not automatically eliminate a substantive tax liability, and the outcome of an export-related refund can depend on the documents and the statutory definition relevant to that supply.
Tax teams should preserve application acknowledgements, demand orders, pre-deposit proof, bank realisation evidence, credit distribution workings and correspondence. Where a clarification affects an ongoing appeal or refund, assess whether a representation or revised evidence pack is appropriate.
Direct tax: quarterly TDS statements and AY 2026-27 filing calendar
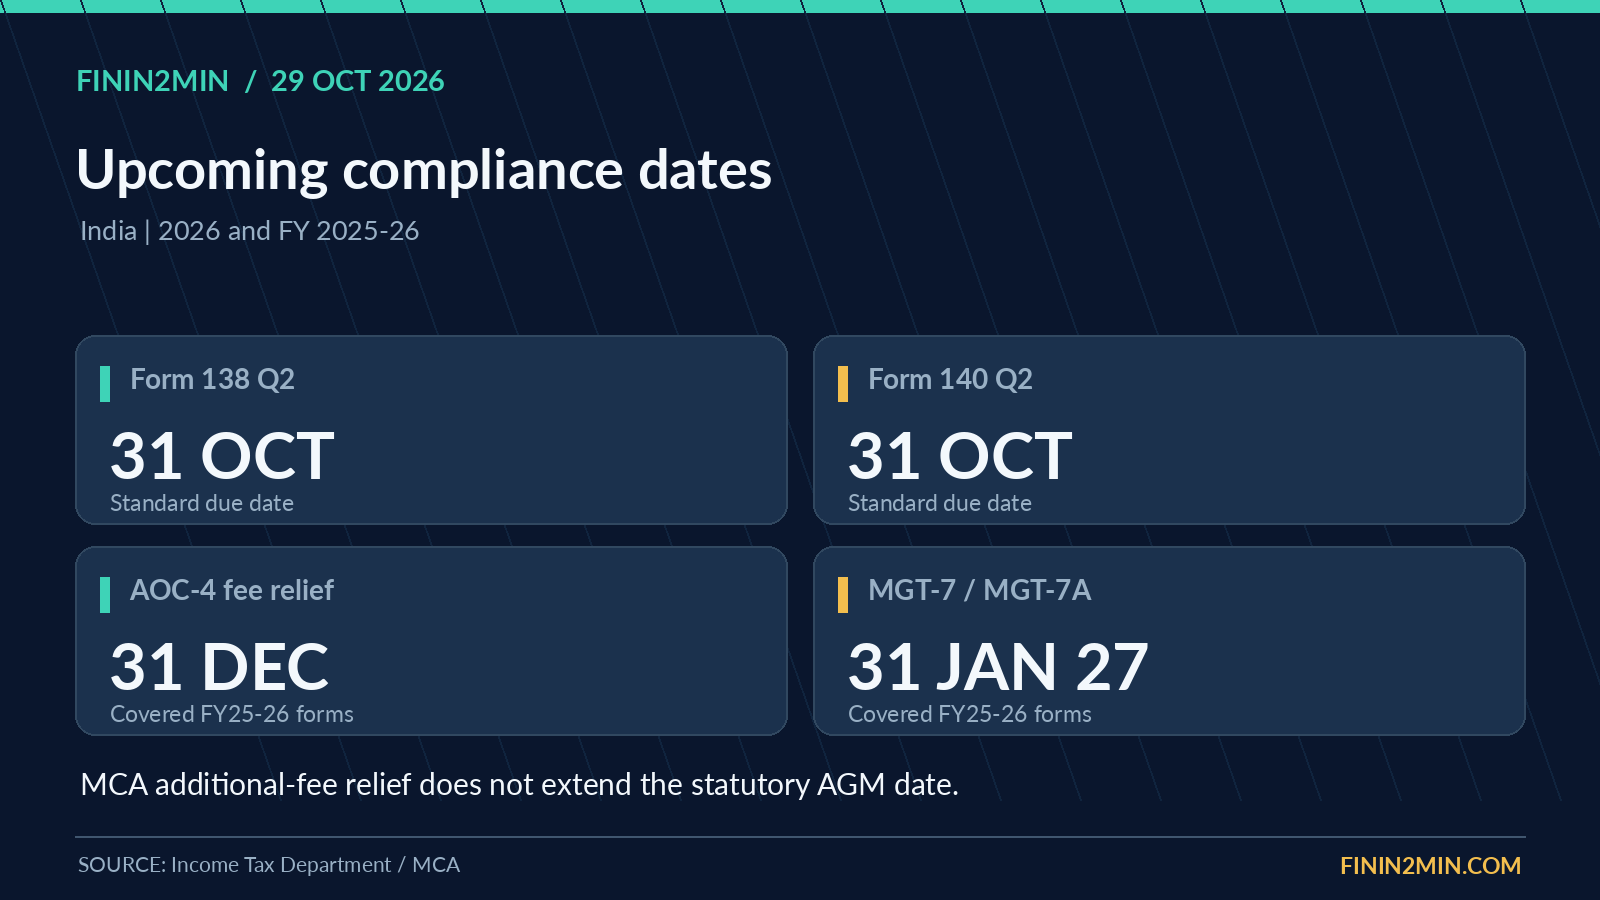
DIRECT TAXIncome-tax Form 138, replacing the old Form 24Q nomenclature for salary and certain specified deductions, and Form 140, replacing Form 26Q for non-salary resident deductions, carry the standard July-September quarter filing date of 31 October 2026. Deductors should reconcile challans, deduction dates, deductee identifiers and transaction categories before submission.
For eligible audit-category taxpayers under the previously applicable provisions for assessment year 2026-27, CBDT Circular 07/2026 extended the relevant income-tax return date to 21 November 2026; the audit-report extension was to 21 October. An extension applicable to one statutory category should not be carried across to all taxpayers or forms.
Key controls include matching the TDS ledger to the general ledger, validating PAN/TAN details, checking revised or lower-deduction certificates and resolving unmatched challans. In a group with multiple payroll and finance entities, maintain a separate entity-wise filing dashboard and evidence of acknowledgement.
Companies Act: FY 2025-26 annual-filing relief and AGM distinction
MCA / COMPANY LAWMCA General Circular 05/2026 dated 24 October allows FY 2025-26 financial statements in specified AOC-4 variants to be filed up to 31 December 2026, and annual returns in MGT-7/MGT-7A up to 31 January 2027, without additional fees within the scope of the circular.
The relief does not extend the statutory AGM deadline. Companies should therefore distinguish the date of the board approval, signing and adoption of financial statements, auditor-report dates, AGM compliance and the actual e-form filing window.
The practical checklist is to verify the form variant relevant to Ind AS, NBFC or consolidation; ensure XBRL tagging where required; check director signatories and digital signatures; and preserve meeting records, attachments and SRN acknowledgements. Where a company failed another Companies Act requirement, the absence of an additional filing fee does not, by itself, cure that non-compliance.
SEBI investor protection and market-structure calendar
SEBI / CAPITAL MARKETSSEBI’s circulars issued this month address the closing auction session, derivatives settlement methodology, early pay-in related margin treatment, research-analyst record requirements and debenture trustees. Different circulars carry different effective dates and compliance populations.
Of immediate operational relevance, SEBI’s investor-awareness instruction requires specified broker website messages from 1 November 2026 and alternating visibility of investor-awareness messages and risk disclosures on relevant trading-app landing pages. Brokers and technology teams should test the correct text, visibility, user journey and records of compliance.
Market participants should check each framework’s scope rather than treating a new circular as a uniform rule for all institutions. Retail investors should use SEBI and exchange publications for official margin rules, settlement timing and investor warnings.
Trade policy and MSME competitiveness
TRADE & MSMEIndia’s Commerce and Industry Ministry used 29 October engagement with export organisations to emphasise quality, scale, global market access and export diversification. The focus is relevant to businesses facing a volatile rupee, high freight costs and a potentially uneven outlook for European and US demand.
An exporter’s sustainable profit is determined by both selling price and the full cost to serve the overseas buyer: logistics, credit period, certification, trade finance, insurance, customs procedures and currency exposure. The move in one global benchmark rarely captures all these costs.
For MSMEs, consider a weekly cash-flow sensitivity grid across three variables: order volume, working-capital days and landed logistics/import costs. Targeted improvement in invoicing, collections, bank limits and supply-chain visibility is often more controllable than a directional currency forecast.
Compliance and events: the immediate calendar
ACTION DESK31 October 2026 is the standard Q2 filing date for the applicable Form 138 and Form 140 TDS statements for FY 2026-27. The relevant GSTR, tax-audit, income-tax-return and corporate-law obligations must be checked separately because their deadlines and eligible taxpayers are not interchangeable.
1 November marks the commencement window for specified GST changes and SEBI’s stockbroker awareness-message obligations. Under MCA’s circular, covered AOC-4 filings receive additional-fee relief until 31 December 2026, and covered MGT-7/MGT-7A filings until 31 January 2027; neither should be understood as an AGM extension.
On the market side, monitor the next Indian cash-market opening, the latest completed GIFT Nifty contract reference, crude and shipping reports, scheduled earnings and next releases from official agencies. Any new holiday, postponement or notification can change the operative timetable.
What matters in the next session and beyond
MONITORINGA higher Nifty close does not settle the next day’s direction. The most useful confirmation signals are breadth across sectors, how banks and energy users respond to oil, the rupee’s reaction to overseas news and whether foreign institutional selling moderates.
For investors, review portfolio concentration and time horizon before reacting to a single day’s recovery. For CFOs and treasury teams, examine import costs and FX exposure. For CAs, CSs and tax professionals, complete the legal-date and entity-wise filing checks before the month-end deadline.
The broader message from 29 October is a split between a resilient Indian equity session and a global environment still characterised by expensive energy, persistent US inflation and tighter-for-longer funding assumptions.
Compliance calendar
| Date | Event | Applies to |
|---|---|---|
| 2026-10-30 | Next regular cash trading sessionScheduled trading session | Investors, treasury |
| 2026-10-31 | Form 138 Q2 FY 2026-27 salary/certain bank TDS statementOrdinary statutory due date | Relevant TDS deductors |
| 2026-10-31 | Form 140 Q2 FY 2026-27 non-salary resident TDS statementOrdinary statutory due date | Relevant TDS deductors |
| 2026-11-01 | Commencement of specified GST changes; verify transaction-specific notificationSpecified commencement date, not all Council proposals | Registered businesses |
| 2026-11-01 | Broker investor-awareness messages on websites and appsCircular implementation phase | Stockbrokers |
| 2026-11-03 | US midterm electionsScheduled event | Global finance users |
| 2026-11-21 | AY 2026-27 return filing for specified audit-category taxpayersExtended by Circular 07/2026 | Eligible filers only |
| 2026-12-31 | Covered FY 2025-26 AOC-4 variants without additional feesAdditional-fee relief; AGM unchanged | Companies within circular scope |
| 2027-01-31 | Covered FY 2025-26 MGT-7/MGT-7A annual returns without additional feesAdditional-fee relief; AGM unchanged | Companies within circular scope |
Primary documents and global reporting
- Reuters — Indian shares, 29 October 2026 — 29 Oct 2026
- NSE — market data — 29 Oct 2026
- BSE — index data — 29 Oct 2026
- NSE — FII/DII activity — 29 Oct 2026
- Reuters — Oil prices settle lower, 29 October — 29 Oct 2026
- Reuters — Gold and silver, 29 October — 29 Oct 2026 18:09 GMT
- GIFT Nifty futures quote reference — 30 Oct 2026 01:03 IST
- Reuters — Rupee and Indian bonds, 29 October — 29 Oct 2026
- Federal Reserve — FOMC statement — 28 Oct 2026
- Federal Reserve — implementation note — 28 Oct 2026
- BEA — GDP Q3 2026 advance estimate — 29 Oct 2026
- BEA — September 2026 personal income and outlays — 29 Oct 2026
- ECB — monetary policy decisions — 29 Oct 2026
- Associated Press — US market close — 29 Oct 2026
- Reuters — Global markets, 29 October — 29 Oct 2026
- PIB/MoSPI — August trial ISP — 29 Oct 2026
- MoSPI — September industrial production, official release list — 28 Oct 2026
- Adani Ports — Q2 FY27 results — 28 Oct 2026
- SEBI — circular register — to 29 Oct 2026
- SEBI — October 1 stockbroker app/website requirements — 1 Oct 2026
- PIB — 57th GST Council recommendations — 8 Oct 2026
- CBIC GST official circulars — 26–28 Oct 2026
- Income Tax Department — Form 138 user manual — FY 2026-27 Q2
- Income Tax Department — Form 140 user manual — FY 2026-27 Q2
- Income Tax Department — latest news / Circular 07/2026 — 28 Sep 2026
- MCA — company law general circular 05/2026 — 24 Oct 2026
- PIB — Commerce and Industry releases — 29 Oct 2026
- RBI — notifications and press releases — to 29 Oct 2026
- IFSCA — official circulars — to 29 Oct 2026
- EPFO — official website — to 29 Oct 2026
Finin2min Research Desk · 29 October 2026 · Market observations are dated by instrument and session. For general education and information only; not investment, tax or legal advice. Statutory obligations depend on the person, transaction, applicable legislation and relevant notification.